You are using an out of date browser. It may not display this or other websites correctly.
You should upgrade or use an alternative browser.
You should upgrade or use an alternative browser.
- Joined
- Sep 15, 2016
- Messages
- 28,137
- Reputation
- 23,201
- Reaction score
- 116,974
- Points
- 0
- Currently Smoking
- Dabs of Rosin.
Cool I will be in touch as soon as the calibration test is completed.Hey, that is true, we can calibrate remotely, whenever you're ready just shoot us an email and we'll get you taken care of.
I've got a user driven calibration feature in the works, and we're improving our factory pre-calibration process as well.
- Joined
- Sep 15, 2016
- Messages
- 28,137
- Reputation
- 23,201
- Reaction score
- 116,974
- Points
- 0
- Currently Smoking
- Dabs of Rosin.
@wwwillie: you hit it on the nose same information just different scales and granularity. The leaf temp charts are better but they don't have farenheit for USA thinkers. If you have a laser thermometer you can get leaf temperature with that but I get readings all over the place in the canopy so ?????? I have a really difficult time in my small personal grow space controlling humidity so just getting close to any of those charts is good for me.Hey Brother @Waira how are you?!
Ya, I agree. I am still trying to find out the Leafs cooler that surrounding air and just how that is determined and just what real difference it makes. I try to aim for a middle ground and hope I'm close. I am still working it all out but at least with the Pulse Nano I can track it so as to try to keep it in bounds.
The difference I see are the units of measure with the two charts in kPa and no mention in the top chart. In looking at the 26C 65% band on all charts that combo is green, so they are close...
I really don'r know I guess! I do know that trying to keep VPD close to the "proper" levels is making a positive impact on my garden.
I have to say that I learned about VPD quite a while ago and striving to get there did improve my grows but this tool and the graphs are so informative that I know I will be able to do a better job using it. Fear of bud rot prevents me from running in the proper zone late into flower. I just can't do it!
- Joined
- Mar 11, 2013
- Messages
- 17,226
- Reputation
- 6,039
- Reaction score
- 55,652
- Points
- 0
- Currently Smoking
- fine-ass '22 harvest!
Hey Brother @Waira how are you?!
Ya, I agree. I am still trying to find out the Leafs cooler that surrounding air and just how that is determined and just what real difference it makes. I try to aim for a middle ground and hope I'm close. I am still working it all out but at least with the Pulse Nano I can track it so as to try to keep it in bounds.
The difference I see are the units of measure with the two charts in kPa and no mention in the top chart. In looking at the 26C 65% band on all charts that combo is green, so they are close...
I really don'r know I guess! I do know that trying to keep VPD close to the "proper" levels is making a positive impact on my garden.
...
 ..doing OK my friend!
 I did some more (non-late night!) digging, and @Mañ'O'Green is right about the scale on the first graph,... I think it's in hectopascals, vs kilopascals in the others,.... I think it all comes down to what calculations you use too... the video in the Reference section goes through the VPsat calculation too,... I have compare the equations from below to the one in the vid and run the same numbers,... but that scale difference is solved at least! See, this is why growing OD's has it's advantages-

How to calculate VPD in a cannabis culture
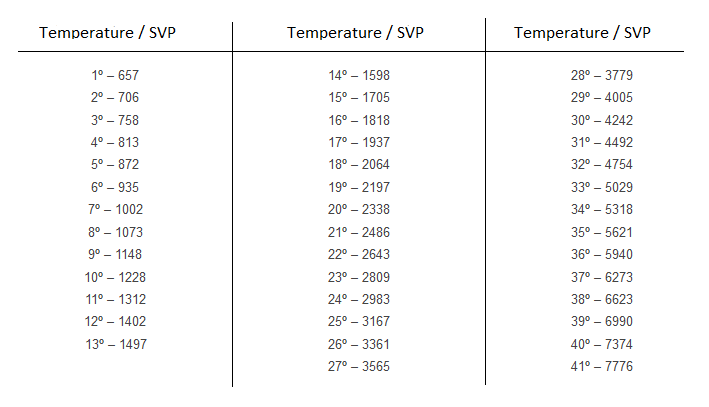
In order to calculate the vapor pressure deficit in our grow space, we just need to know the temperature and relative humidity inside it. We also need to know the saturated vapor pressure (SVP) values for a given temperature, which are listed below.
Saturated steam pressure values chart
(Temperature: Celsius / SVP: Pascals)

Saturated vapor pressure and temperature
We use the following formula to calculate the VPD:
VPD= ((100-RH) / 100) * SVP
Let’s see an example: imagine that we have a grow room at 28°C with a relative humidity of 75%. If we take a look at the SVP chart, we will know that at 28 degrees Celsius corresponds to 3779 Pa. Let’s apply the formula:
VPD = ((100-75) / 100) * 3779 so VPD = 0.25 * 3779 = 945 Pascals = 9.45 Hectopascals
Considering that values of the table are given in Hectopascals, this gives us a result of 9.45 hPa, a value located in the green area of the chart, perfect for our plants development. If we subtract the SVP value that we got, we will know the saturation deficit, that is, the amount of water that the environment still needs to form dew.

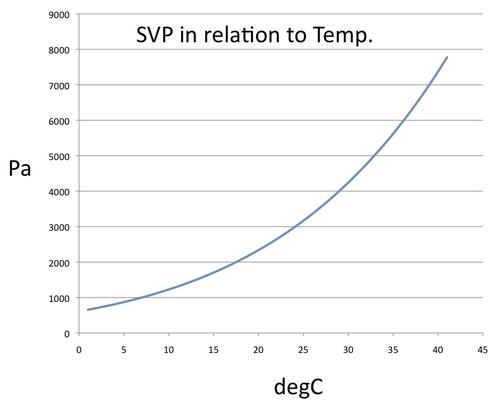
SVP (pascals) according to temperature (celsius)
Low levels of VPD combined with high relative humidity (light red zone) may cause nutrient deficiencies, guttation phenomenon, different diseases or weak growth; while a high SPD value combined with low relative humidity (dark red zone) it could cause wilting, curled leaves, poor growth or crisp leaves.
- Joined
- Sep 15, 2016
- Messages
- 28,137
- Reputation
- 23,201
- Reaction score
- 116,974
- Points
- 0
- Currently Smoking
- Dabs of Rosin.
.....doing OK my friend!
I did some more (non-late night!) digging, and @Mañ'O'Green is right about the scale on the first graph,... I think it's in hectopascals, vs kilopascals in the others,.... I think it all comes down to what calculations you use too... the video in the Reference section goes through the VPsat calculation too,... I have compare the equations from below to the one in the vid and run the same numbers,... but that scale difference is solved at least! See, this is why growing OD's has it's advantages-
How to calculate VPD in a cannabis culture
In order to calculate the vapor pressure deficit in our grow space, we just need to know the temperature and relative humidity inside it. We also need to know the saturated vapor pressure (SVP) values for a given temperature, which are listed below.
Saturated steam pressure values chart
(Temperature: Celsius / SVP: Pascals)

Saturated vapor pressure and temperature
We use the following formula to calculate the VPD:
VPD= ((100-RH) / 100) * SVP
Let’s see an example: imagine that we have a grow room at 28°C with a relative humidity of 75%. If we take a look at the SVP chart, we will know that at 28 degrees Celsius corresponds to 3779 Pa. Let’s apply the formula:
VPD = ((100-75) / 100) * 3779 so VPD = 0.25 * 3779 = 945 Pascals = 9.45 Hectopascals
Considering that values of the table are given in Hectopascals, this gives us a result of 9.45 hPa, a value located in the green area of the chart, perfect for our plants development. If we subtract the SVP value that we got, we will know the saturation deficit, that is, the amount of water that the environment still needs to form dew.

SVP (pascals) according to temperature (celsius)
Low levels of VPD combined with high relative humidity (light red zone) may cause nutrient deficiencies, guttation phenomenon, different diseases or weak growth; while a high SPD value combined with low relative humidity (dark red zone) it could cause wilting, curled leaves, poor growth or crisp leaves.
Wow just look at all of that math that the Nano does for us
 .
.- Joined
- Mar 11, 2013
- Messages
- 17,226
- Reputation
- 6,039
- Reaction score
- 55,652
- Points
- 0
- Currently Smoking
- fine-ass '22 harvest!
 no lie!
  ... I'm still blocking all the statistics and calculus beaten into my head over the years,... It is a language, and I have no real skills with it, I have to grind it all out! Now, so much is dusty,... use it or lose it, just like language too...
 ... though PEMDAS can get you pretty far-
I consider the ability to easily calibrate by us users as an essential feature.Cool I will be in touch as soon as the calibration test is completed.
- Joined
- Sep 15, 2016
- Messages
- 28,137
- Reputation
- 23,201
- Reaction score
- 116,974
- Points
- 0
- Currently Smoking
- Dabs of Rosin.
I can do it but why? And looking at those graphs it is a moving target.no lie!
... I'm still blocking all the statistics and calculus beaten into my head over the years,... It is a language, and I have no real skills with it, I have to grind it all out! Now, so much is dusty,... use it or lose it, just like language too...
... though PEMDAS can get you pretty far-

Every Indoor Grower Needs a Pulse Nano.
- Joined
- Mar 11, 2013
- Messages
- 17,226
- Reputation
- 6,039
- Reaction score
- 55,652
- Points
- 0
- Currently Smoking
- fine-ass '22 harvest!
ayuh! I just wanted to see what the Pulse values are showing, vs. that funky chart at the top,... It does beg the question about how the pulse is calculating VPD, when the leaf temp is not actually measured,.. As you see, just 1 degree C skews it significantly,... the video mentioned that if the leaf surface temp' is at or warmer than the air temp, likely the lights are too close,....
ayuh! I just wanted to see what the Pulse values are showing, vs. that funky chart at the top,... It does beg the question about how the pulse is calculating VPD, when the leaf temp is not actually measured,.. As you see, just 1 degree C skews it significantly,... the video mentioned that if the leaf surface temp' is at or warmer than the air temp, likely the lights are too close,....
I have measured leaf temps with an infrared thermometer, and compared it with the average of 4 or 5 RH meters placed near the top of the canopy at the same height as Pulse.
Inside a 3 ft x 3 ft tent are a couple stationary fans, and one oscillating fan, so the air is very well mixed.
The air temp right at the canopy is usually about 4 degrees F below the average of those RH meters, due to the cooling effect of transpiration.
That temp difference throws VPD calculations and Pulse temp readings off.
The ability for users to self calibrate would solve this problem, but could possibly lead to others.
Similar threads
- Replies
- 16
- Views
- 2K
- Replies
- 631
- Views
- 62K
